Finance Analytics
The Finance analytics gives you an at-a-glance view of how your network is performing financially — revenue, sales, average spend per customer, and which hotspots are bringing in money — without having to generate and download a report. It's the daily-driver overview that sits alongside Reports: Reports is for exporting raw data, the Finance dashboard is for seeing the big picture at a glance.
To open it, navigate to Analytics → Finance in the admin panel.
Filtering the dashboard
Two filters at the top control everything on the page at once:
- Location — narrow the whole dashboard to a single location, or leave it on all locations.
- Period — the time window all the numbers are calculated for.
The period control has quick presets — Today, Last 7 days, Last month, and Last 3 months — for one-click selection:

Choose Custom and a date-range picker appears so you can set any window you like.
TIP
Your selected filters are saved in the page address, so you can bookmark a view or share the link with a colleague and they'll see exactly the same period and location.
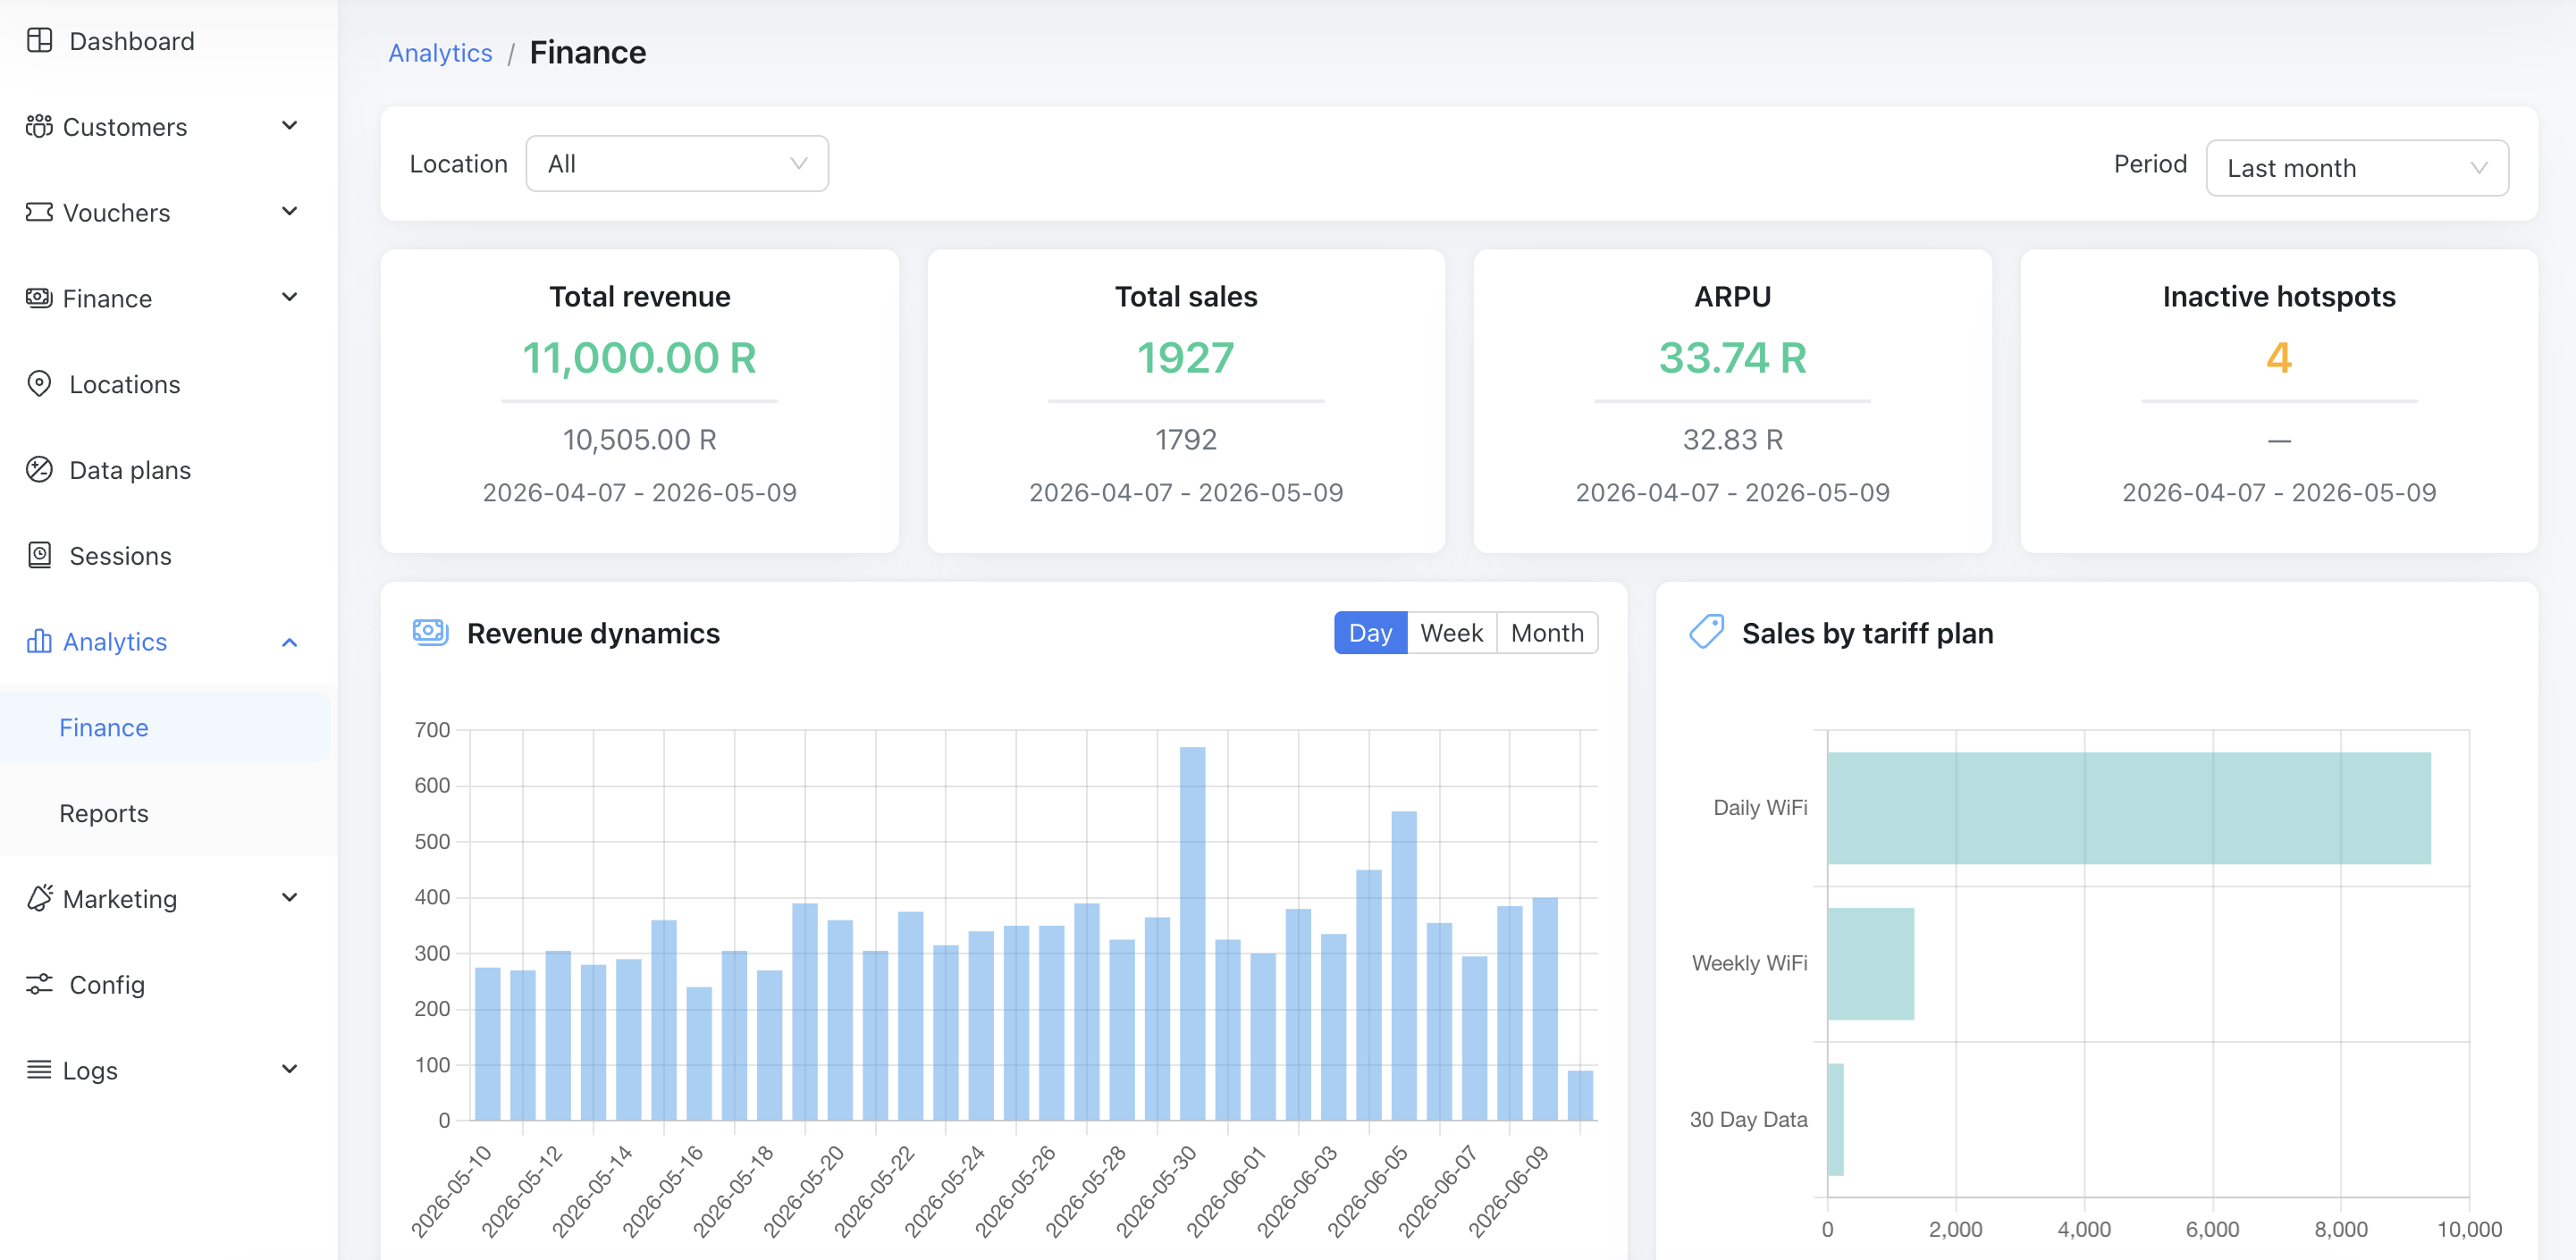
What the dashboard shows
KPI cards
Four headline metrics for the period you selected, each compared against the period of the same length immediately before it (so you can see whether you're up or down):
- Total revenue — money taken in over the period.
- Total sales — number of payments.
- ARPU — Average Revenue Per User, i.e. how much an average paying customer spent.
- Inactive hotspots — how many of your hotspots made no sales at all during the period.
All figures are net — refunded and removed payments are subtracted, so the numbers reflect what you actually kept.
Revenue dynamics
A bar chart of your revenue over time. Switch the grouping between Day, Week, and Month in the card header to zoom in on recent activity or step back for the longer trend. Periods with no sales show as zero, so gaps don't distort the shape of the chart.
Sales by tariff plan
Your top 10 data plans ranked by the revenue they brought in over the period — a quick way to see which plans your customers actually buy.
Hotspot revenue performance
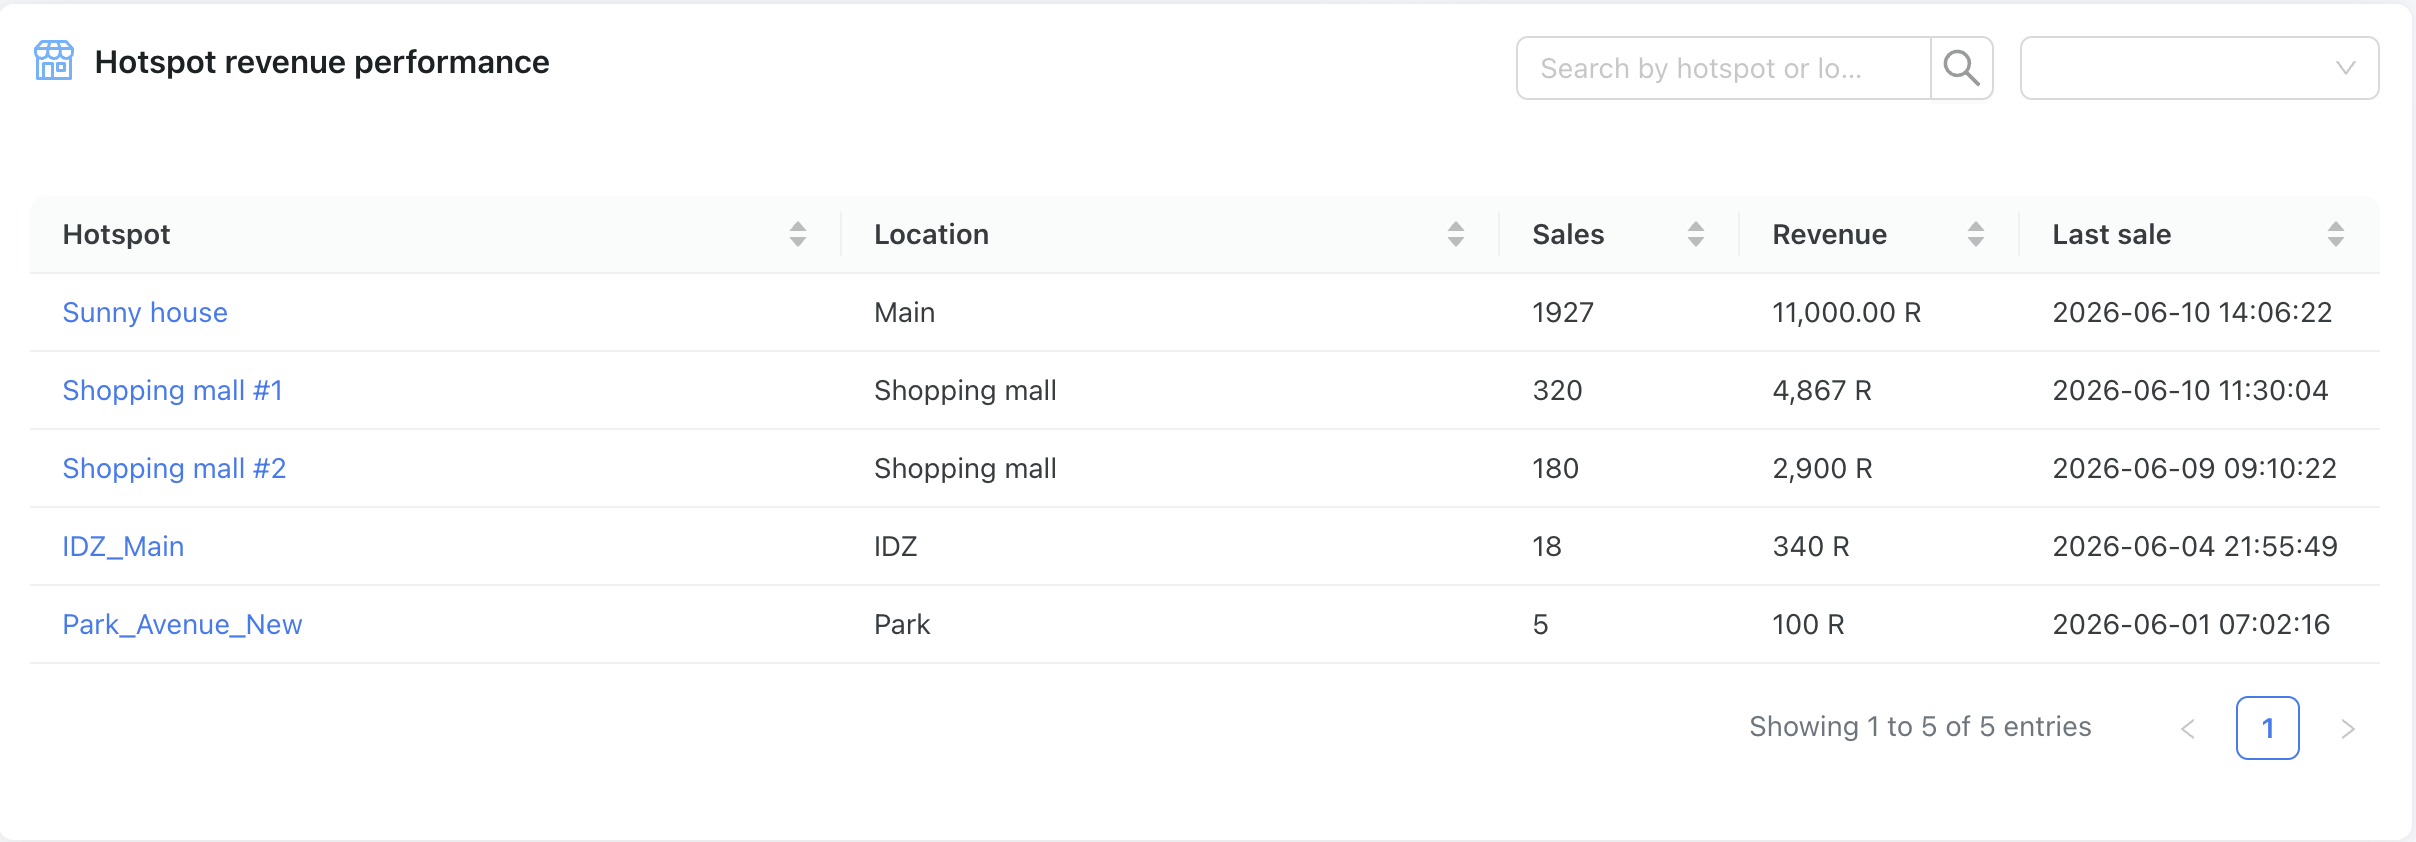
A table at the bottom of the dashboard showing how each of your hotspots is doing:
- Hotspot — the hotspot name (click it to open the hotspot's page).
- Location — where the hotspot is.
- Sales — number of payments made at that hotspot.
- Revenue — money the hotspot brought in.
- Last sale — when the most recent payment happened, in your timezone.
INFO
Every hotspot you have is listed here, even ones that made no sales — that's exactly how you spot the Inactive ones that might need attention (wrong placement, an offline router, or a splash page that isn't converting).